|
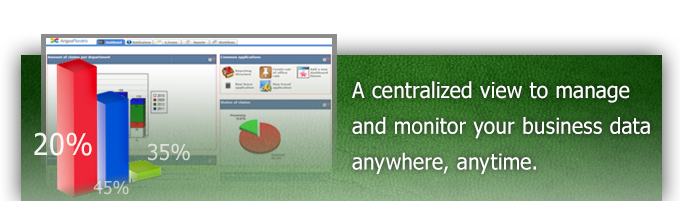
The Flowtrix Process Dashboard consolidates data and presents them in a graphical format so that you can have eyes on your business, 24x7, anytime and anywhere! You have the flexibility to surface a variety of information rapidly from a magnitude of applications and processes that are deployed on the platform, and present them in 9 different formats to your end-users. End-users will then be able to subscribe for the view that they require. Your business is dynamic. Never be constrained by static reports which can become out-dated quickly. Run your business real time with Flowtrix Process Dashboard. Make that critical decision today!
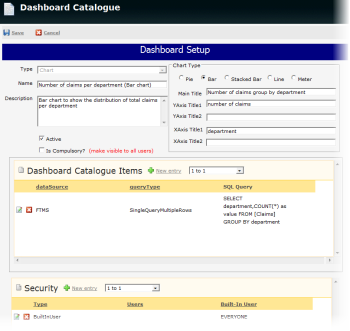
Simple-to-operate administrative features allow the Dashboard designer to develop and configure dashboard catalogues for end-user subscription. The dashboard developer utilizes out-of-the-box platform security controls for each catalogue to configure access rights for individual users, groups of users or all users in the system.
Configure complusory dashboard catalogue views so that the same information can be surfaced to everyone in the organization at the same time. You now have the ability to distribute dashboard catalogues en-masse at a click of a button!
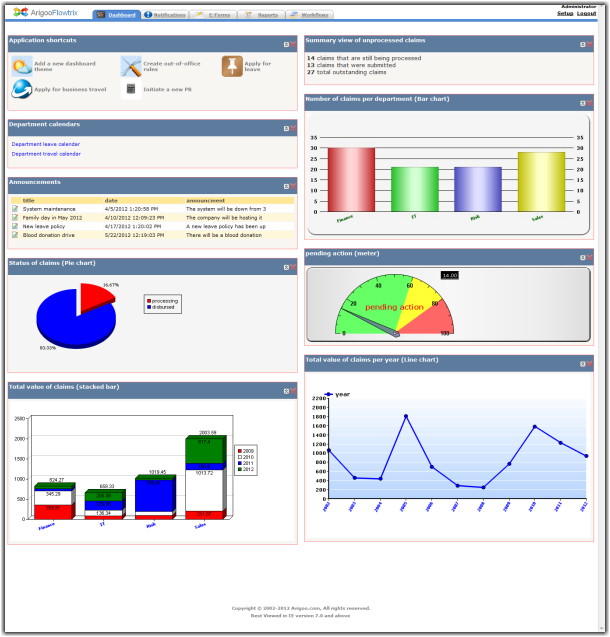
Create dynamic queries to surface information using 5 different catalogues shown below:
- Shortcuts
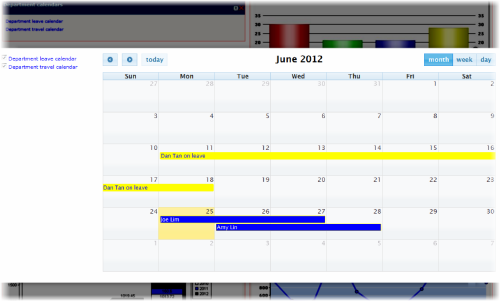
- Calendars
- Summary
- Lists
- Charts - Pie, Bar, Stacked bar, Line, Meter
Each user in the system has a personalized dashboard view, where he/she can subscribe for a published catalogue as well as drag-and-drop to reposition dashboard catalogues according to individual preferences.
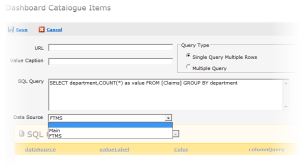
Connect to various data source with support for ODBC and use standard SQL query statements to generate data for visualization. Flowtrix Process Dashboard gives you the ability to aggreate data from various sources for a bird's eye view of your business!
|